- NJASA
- Curriculum Corner Feb 2019


-
One District's Journey: Putting Student Data in the Hands of Teachers
For many years, Logan Township School District collected paper copies of statewide assessment charts in binders in various district offices with little, if any, analysis of student demographic groups. Upon this current Superintendent’s arrival in the district, there was an effort to assemble a master longitudinal database in order that state summative assessment results for each grade group could more easily be shared with the Board of Education annually. However, expectations grew when more student data became available each year the PARCC assessments were administered. The administrators had more student data than ever before but didn’t have the time (or expertise) to analyze what the data was saying. The district became data rich, yet information poor. As a result of the curriculum development work which had taken place under the watchful eyes of the Supervisor of Curriculum and Instruction, Dr. Kristi Jansen, the district began each year shouting out the good news to the district teachers of the academic achievement, albeit in a static manner.
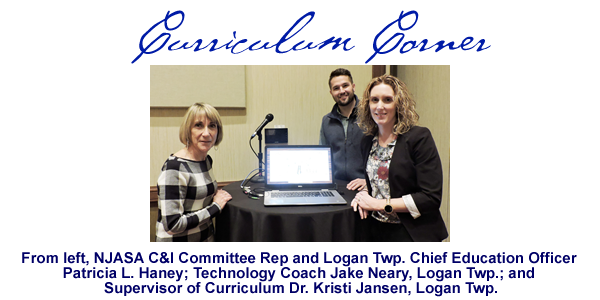
After several years of collecting student data but not using the data to change instruction, the Superintendent assembled a data team which included Dr. Jansen, the Technology Coach Mr. Jake Neary and Mr. Russell Altersitz, a newly-hired Data Analyst. The first goal of this data team was to put the students’ PARCC scores into the hands of each teacher on the first day of school so they could dig into that data to determine a starting point for instruction for the year. Dr. Jansen led the charge by using the power of scatterplots to have each teacher place the scores from two consecutive years of PARCC assessments on the same graph to determine which sector each student fell: Above Proficient/ High Growth; Above Proficient/ No Growth; Below Proficient/High Growth or Below Proficient/ No Growth. Once the data was plotted, Dr. Jansen developed a protocol to guide teachers through this analysis. Teachers then completed this process by answering a series of reflective questions. It was at this time that Dr. Jansen guided teachers into considering what factors were within their control to help students achieve and grow (i.e. consistency of curriculum delivery and staff collaboration) and which factors were not in their control (i.e. poverty, home language and parental involvement). This type of analysis by teachers, coupled with an analysis of the PARCC evidence statements to help identify which standards were successfully achieved and which standards were not, became a routine professional learning event each year.
Having all teachers plot their own student data (even though it could have been done electronically) has developed an awareness of the importance for teachers to “touch” the data. Teachers’ “wheels” are turning each time they ponder what the scatterplots are telling them about their students and how they can move students from the “No Growth” sector to the “High Growth” sector. Now, instead of just looking at summative data from PARCC, teachers have become more comfortable looking to data for answers as they explore formative assessment data, attendance data, Time-In-District (TID) Data, and other demographic data points. The ultimate goal of teachers accepting ownership for their students’ academic growth by owning the available data is becoming a reality.
What a data journey Logan Township School District has been on as the District data team builds a data culture that will be sustainable long after the tenure of this present administration!

